
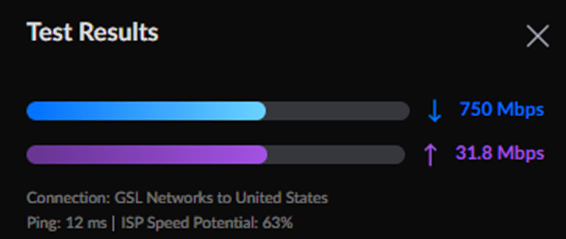
I have Comcast internet at my home and, on-paper, I should get 1.2Gbps (down) and 45Mbps (up). I tested the circuit during the time of initial installation and if I remember correctly, I got close to 1Gbps (down) and 43Mbps (up) directly off the ISP modem. But it’s been 2 years and I sometimes feel that I am not getting the speeds that I should be getting. In the past, I have always blamed the IDS system that’s running on my network but I feel I need some data to back my assumptions. I ran a test off my router and got this –
I envision this monitoring to be two-pronged – HTTP/HTPS monitoring and Speedtest Monitoring.
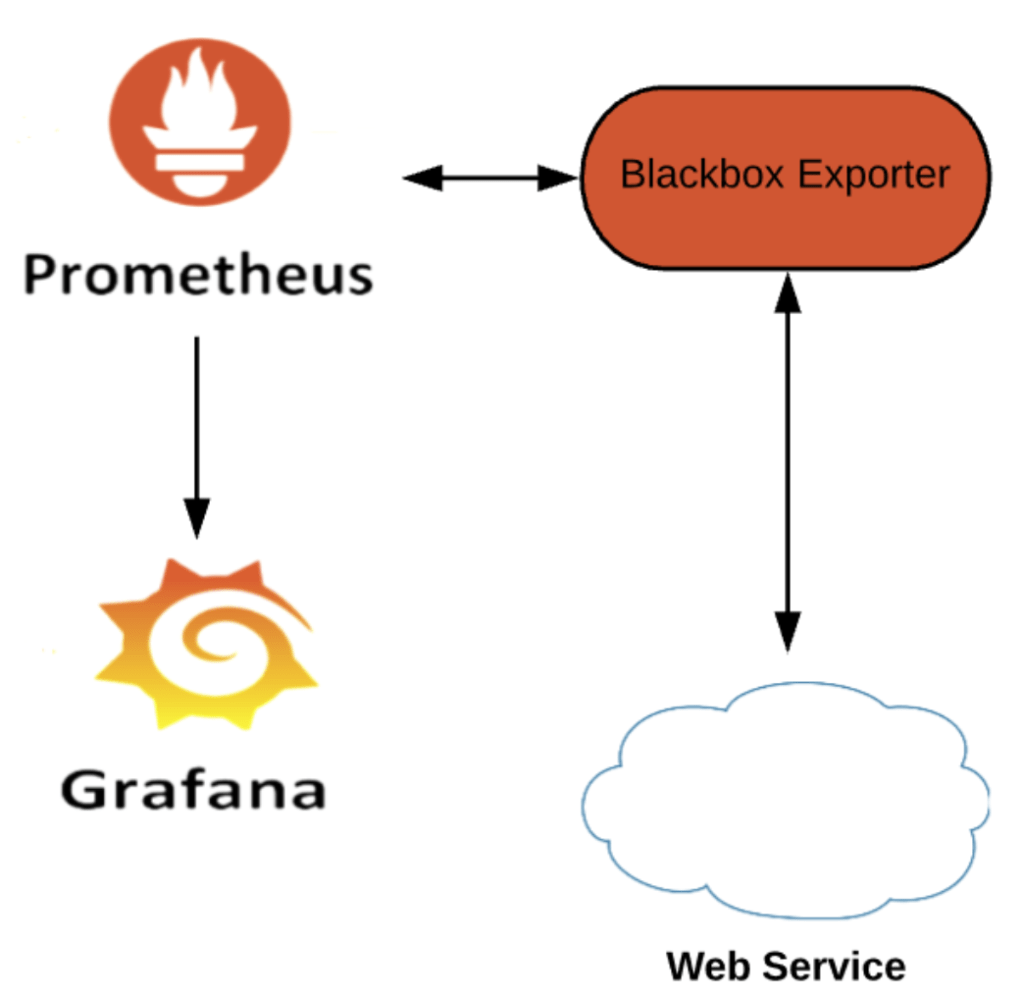
And I would like to utilize my existing Prometheus and Grafana instances to scrape and visualize the data respectively.
I will cover the HTTP monitoring in this post.
Disclaimer – it’s is always best to hardwire the host/source to get best and accurate results for these kind of tests. My Pi is connected to Wi-Fi but will move it to a wired connection later. But I think you got the point.
We need exporters!
I will be using blackbox-exporter for HTTP/HTTPS monitoring (to see if we get a HTTP 200 OK response).
So far, I have been pulling docker images and using them as-is but I have always wanted to build my version of image using Dockerfile.
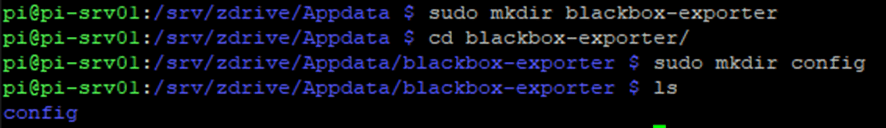
Let’s make a few nested directories within our standard Application location.
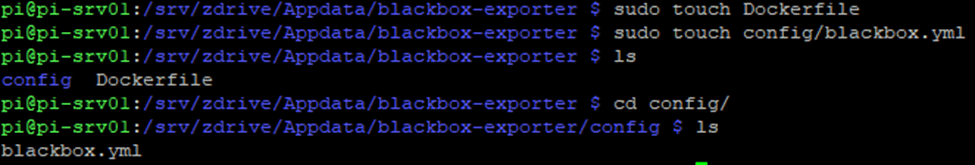
Now, let’s make some files within the newly created directories.
Dockerfile is a text document containing all the commands the user requires to call on the command line to assemble an image. With the help of a Dockerfile, users can create an automated build that executes several command-line instructions in succession.
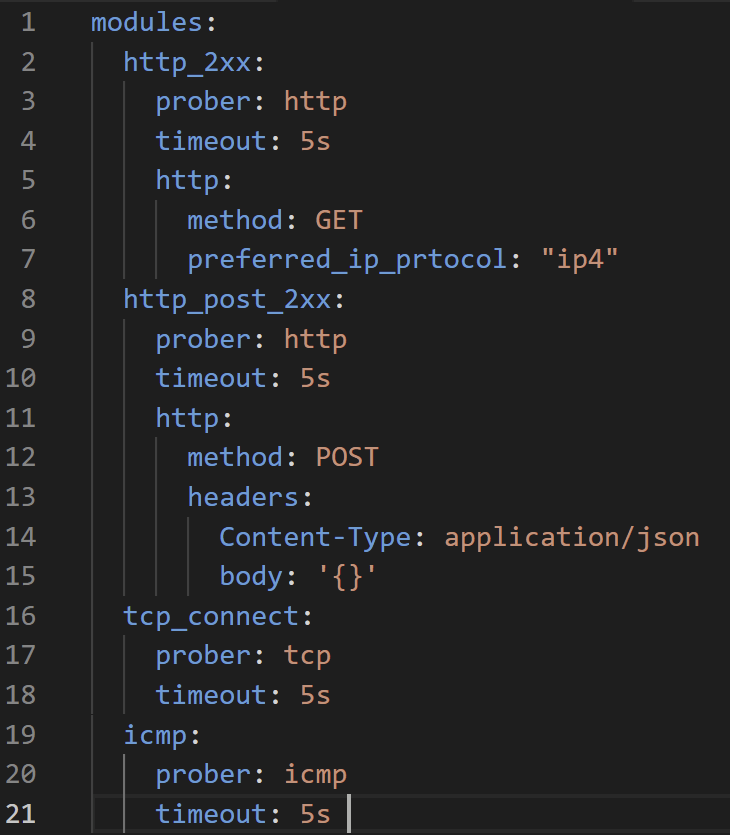
Now, let’s nano into the YAML file and paste in the following configuration. This is to tell the exporter what it will GET and POST.
Save and exist out of it.
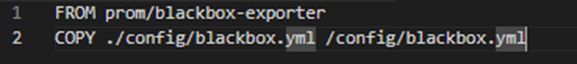
Now, let’s configure the Dockerfile Nano into the file and paste the in the following configuration
Save the file and exit out of it. Now, let’s build our version of the image. Let’s make a docker run for this.
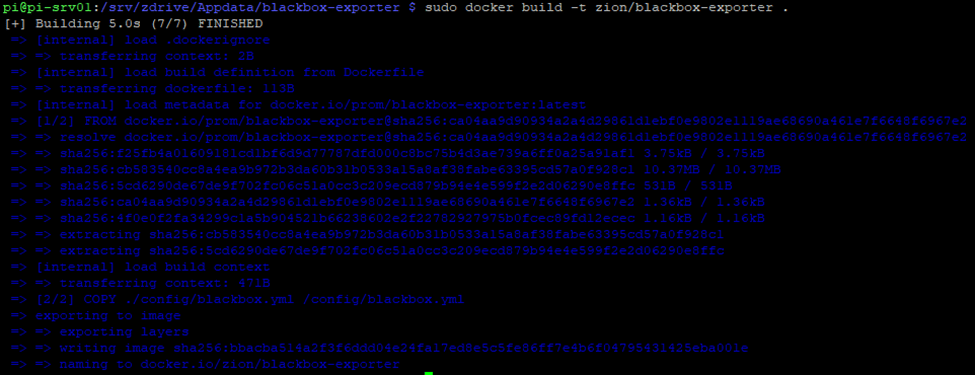
‘–tag/-t’ is Name and optionally a tag in the name:tag format.
The dot(.) at the end of the build command basically tells the Docker that Dockerfile has to be used from the current directory.
Now, let’s check if our image been created or not by running the command ‘docker images’
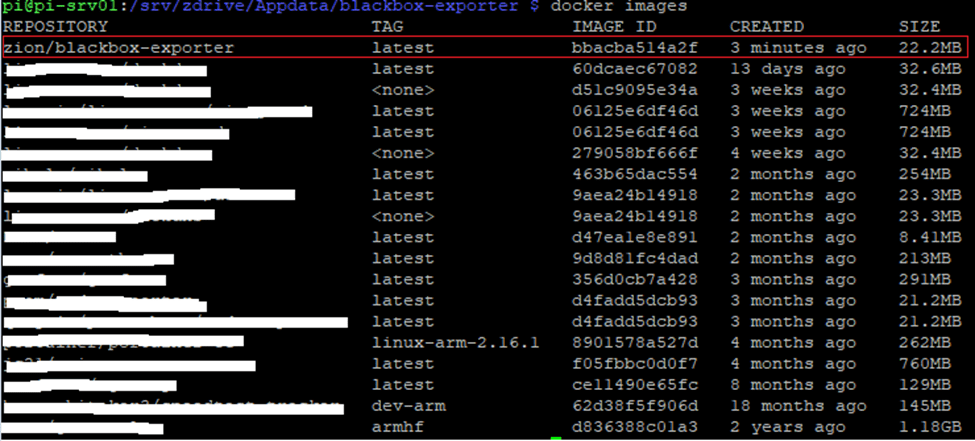
There it is!
Next, we will need to tweak our existing Prometheus config file to add the black-box exporter. Let’s get to the location where prometheus.yml resides and nano the file.

I tweaked the file as follows –
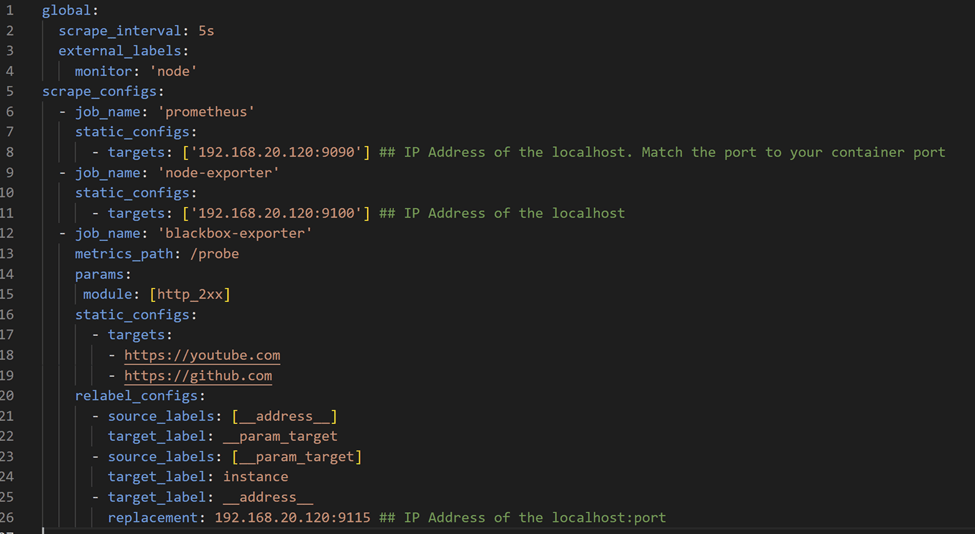
As you can see, I am adding two known websites for monitoring –
Now, let’s create the blackbox-exporter container.

Let’s look at our Portainer to see if the container actually started.

Started but exited. Interesting!
Let’s look at our Prometheus instance to see if our new static targets were added or not.
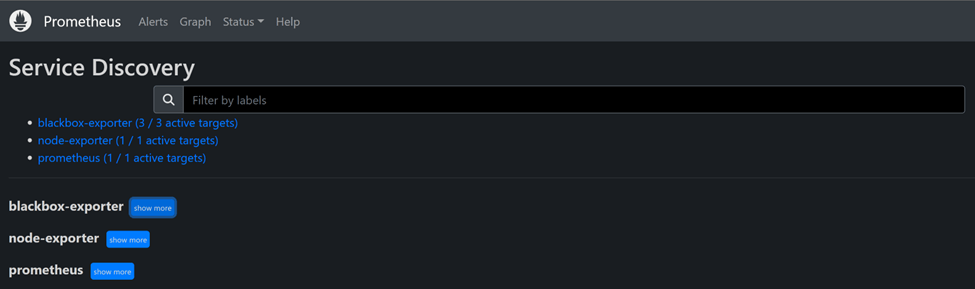
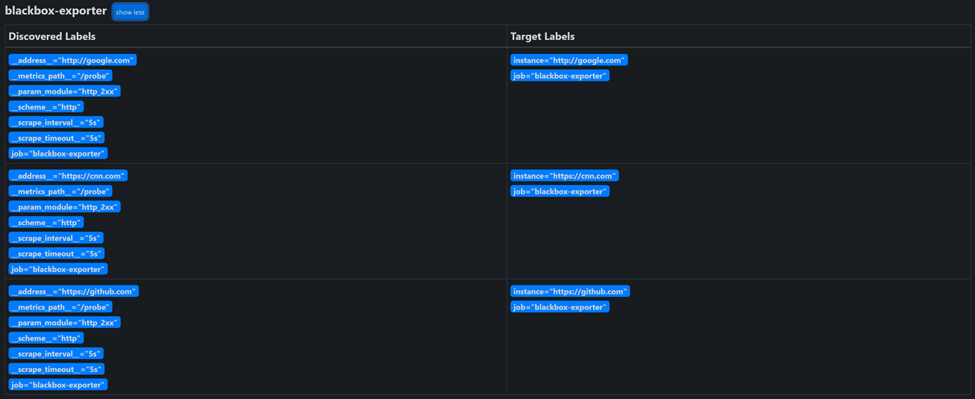
So, everything else is working fine but this new exporter.
Let’s look at the container logs.

After some googling, found out that I need to add ‘two dashes’ for the ‘config.file’ argument. Let’s try again

It works now!
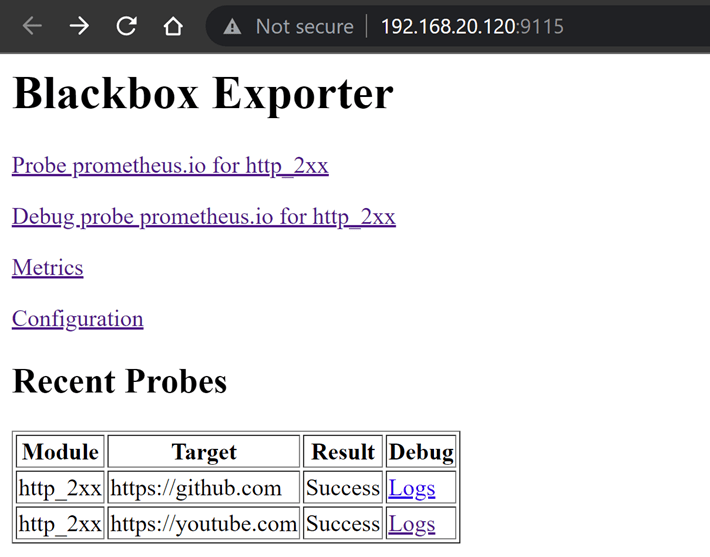
Let’s access the blackbox-exporter on port 9115 to see if everything is good.
Now, it’s time to add a dashboard to our Grafana that will visualize Blackbox-exporter data.
I am using the official Prometheus Blackbox Exporter (ID – 7587).
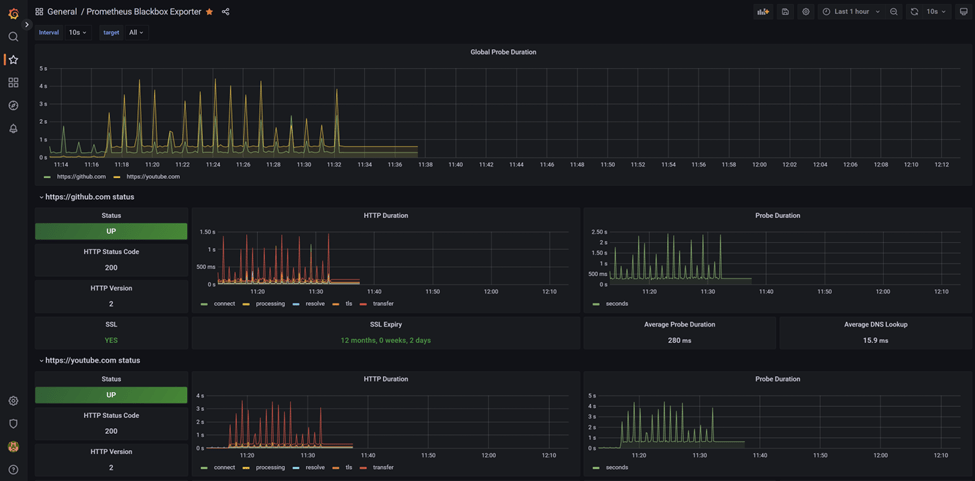
Works like a charm!
Tuned in for the Speedtest configuration.

Leave a comment